
At Superconductor, we use Superconductor to build Superconductor, and one of the great things about this is that it makes it easy to spin up investigations in the background when you come across issues.
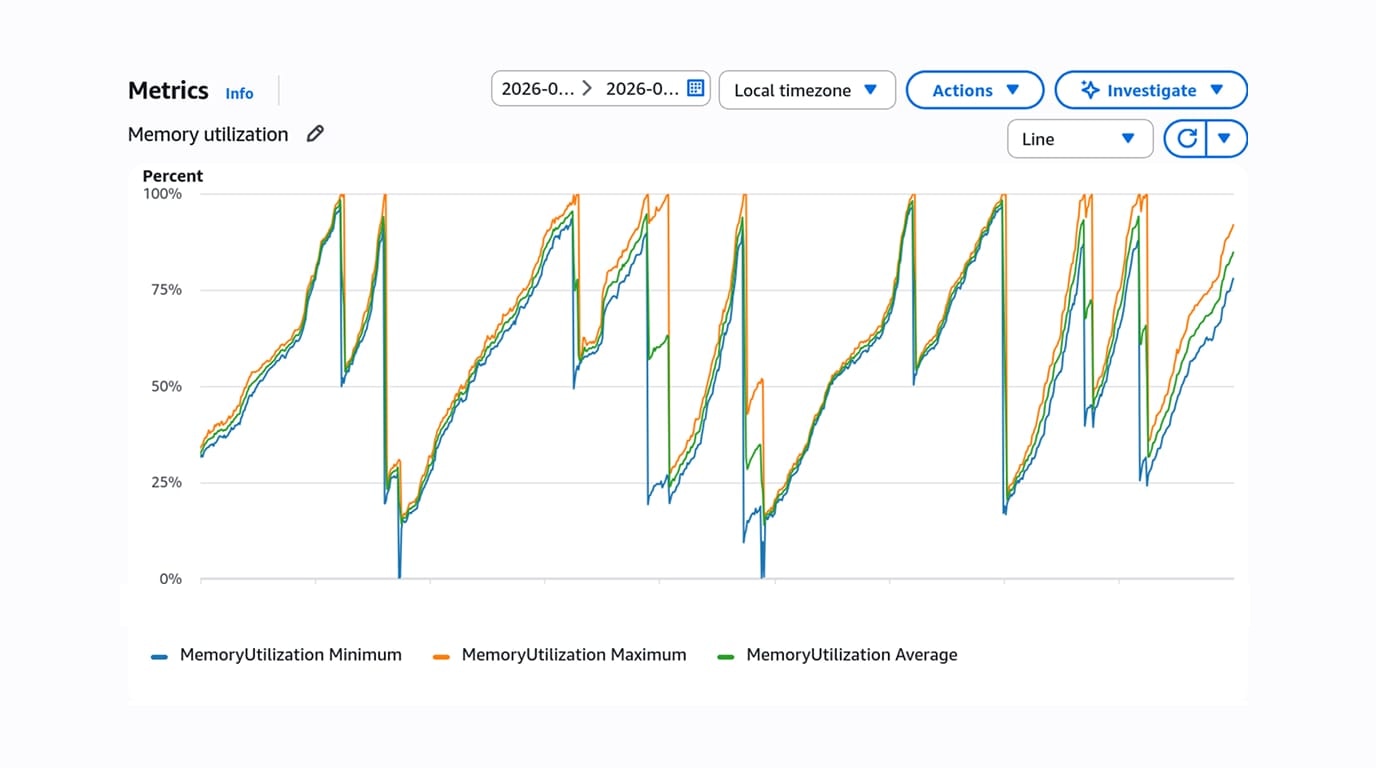
One issue that we’ve been experiencing for a while was that our server memory usage would steadily increase over time until we either redeployed, or the container ran out of memory, restarting the process. This was a perplexing issue but hadn’t been pressing because we deploy frequently, and the container restarts would push off the problem for a while.
However, while debugging a different issue, I noticed that the memory bloat was actually reproducible on any page, so I tasked some coding agents with running our application under derailed_benchmarks to profile the memory retention.
I’ve known about derailed_benchmarks for some time. But configuring the app to run locally in production mode was enough friction that I never got around to setting it up. I didn't want to break my local development environment or affect my work on other tasks. This is a perfect task for background coding agents, because they can identify where your app breaks in a simulated production environment and iterate until it works. As evidenced by projects like autoresearch, agents are great at knocking down objectively measurable tasks autonomously, and with Superconductor, it’s easy to spin up multiple agents on the same task, compare results, and verify the changes.
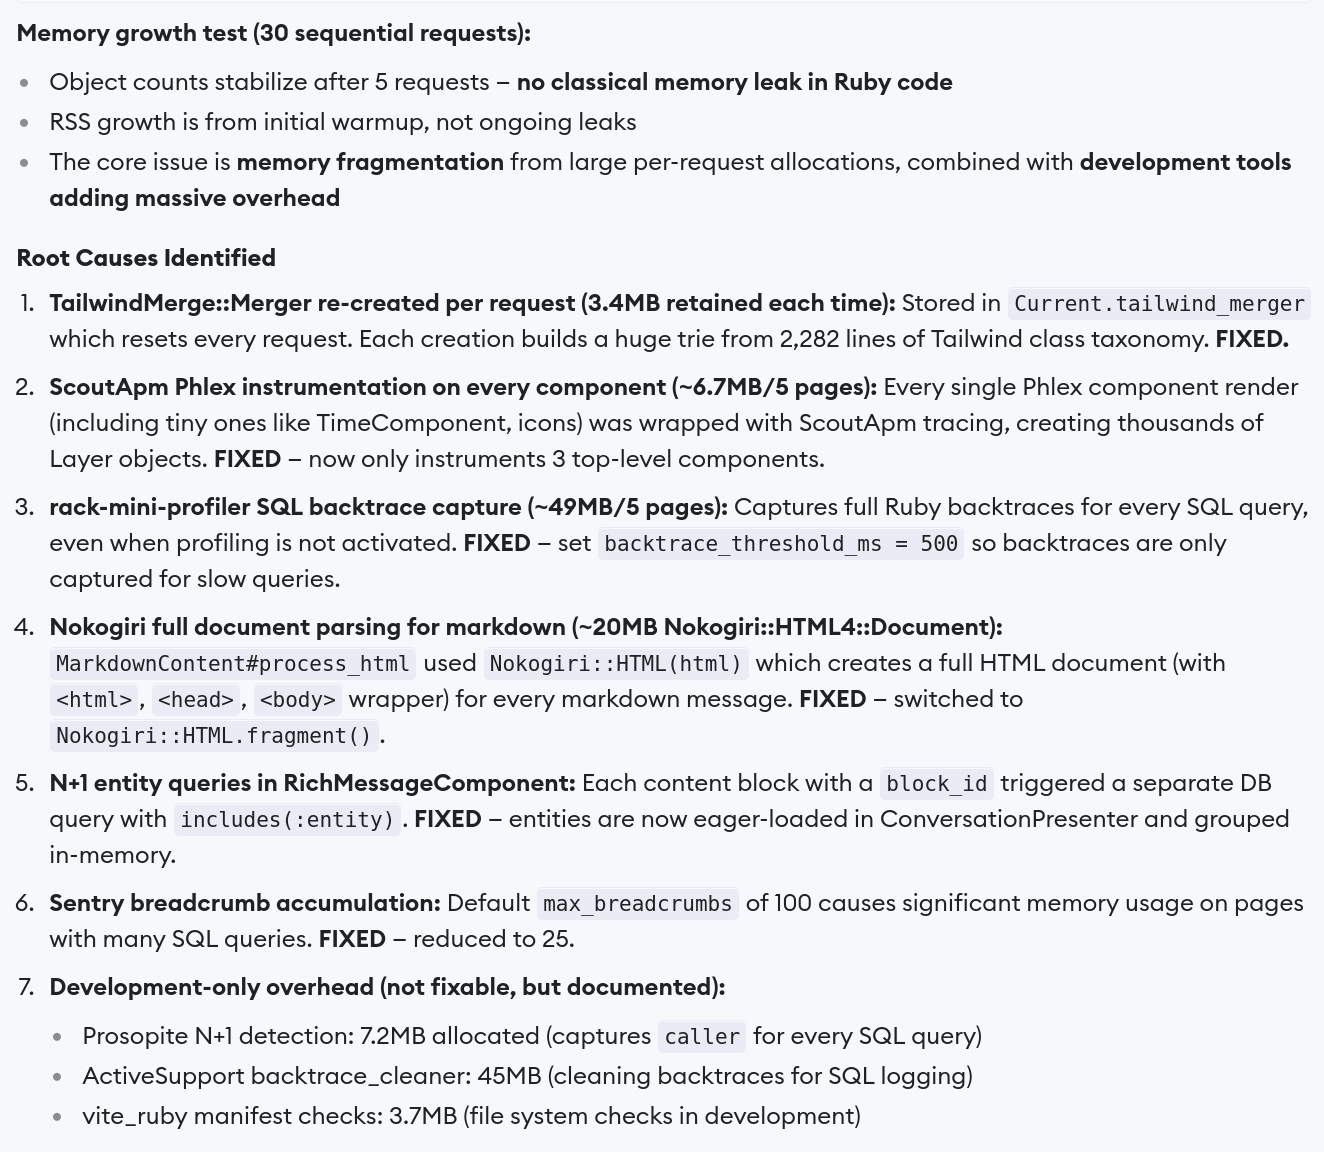
I’d previously assumed that the memory bloat was due to some heavy authenticated pages like the implementation conversation view. So on my first attempt, I instructed the agents to reproduce the issue by populating the conversation view with synthetic data. The agents turned up a handful of different issues, but it was not immediately clear which of the issues were real and which were overblown.
Among the reported fixes were things like preloading N+1 queries (good to do, but not a memory issue), using jemalloc (we already do), and reducing performance instrumentation (plausible, but trades performance for observability, and does not explain retained memory). One other suggestion was to avoid allocating a heavy TailwindMerge::Merger object on CurrentAttributes, but CurrentAttributes is cleared between requests, so I initially dismissed it as the source of persistent memory bloat. Not every agent was successful in configuring derailed_benchmarks to run in production mode, so many of them also surfaced development-only issues that would not be relevant in production. Most agents were convinced that the issue was memory fragmentation, and not a memory leak. With multiple differing suggestions and no clear culprit, I didn’t follow up on that investigation right away.
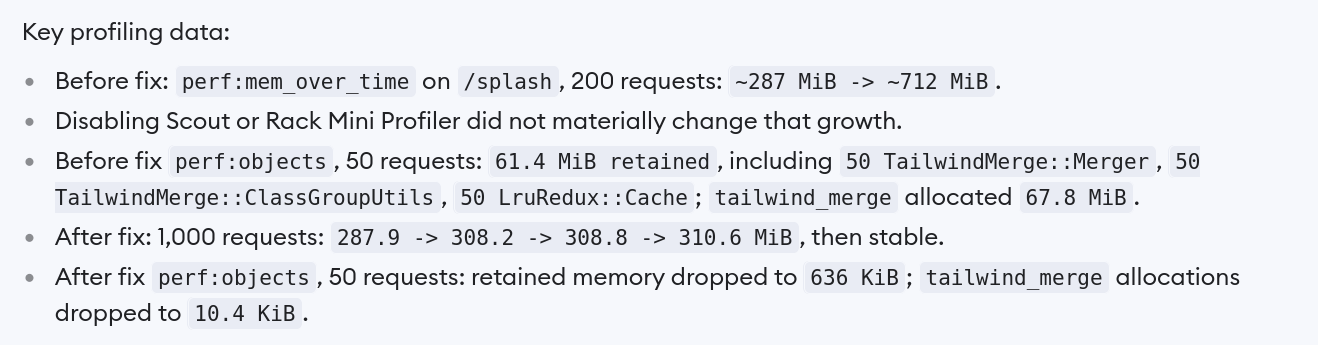
Later, while debugging a different issue, I realized that the memory bloat was occurring on every page, including static pages like the splash page. With the newly simplified reproduction steps, I launched a ticket to look at splash page rendering. This time, 4 out of 5 implementations pointed to the same issue with TailwindMerge, complete with detailed benchmark results. Since the splash page was a much simpler profiling target, we didn't get any spurious suggestions. The benchmark results over many requests gave us confidence that they had identified a real memory retention issue and not something more nebulous.
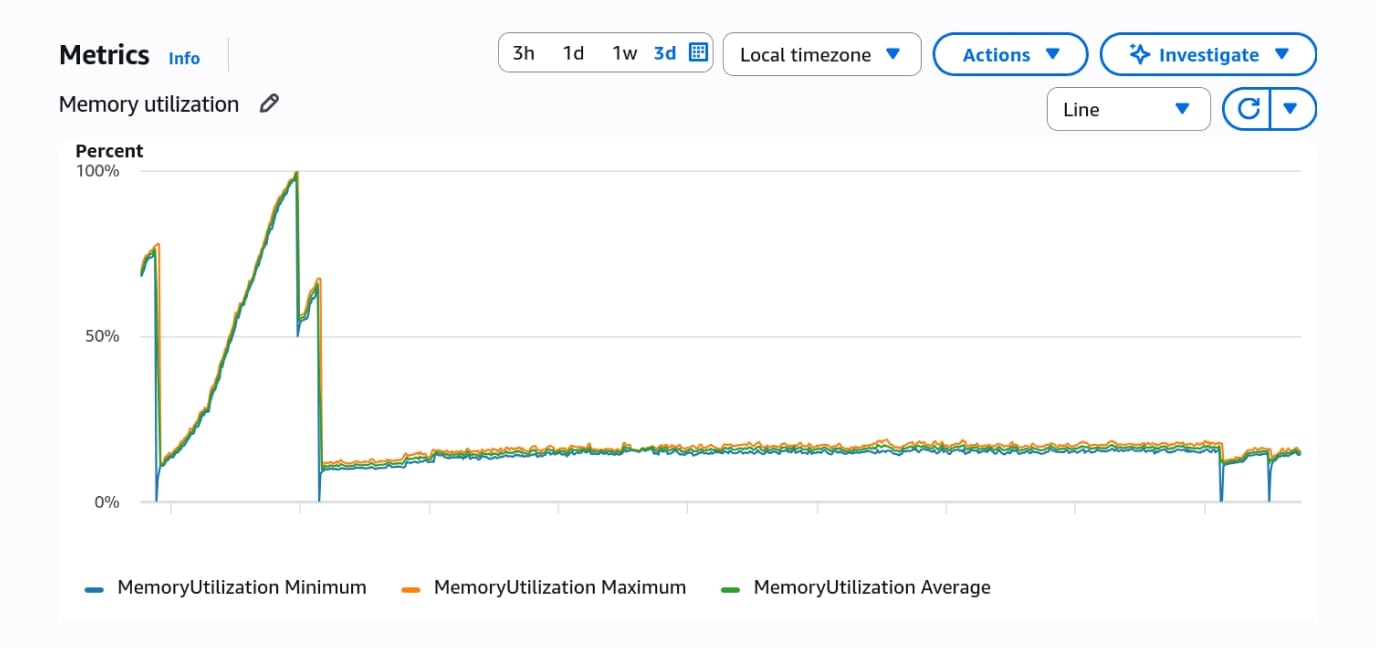
All the coding agents suggested similar mitigations in our application code: move the TailwindMerge::Merger off of CurrentAttributes and reuse it through thread-local storage instead. I made sure the change made sense and tested it in a staging environment to verify that it did indeed solve the memory bloat.
After verifying the mitigation, I pointed some agents towards the gem in question, tailwind_merge. The agents were able to find the root cause: the configuration merging code was mutating a global defaults constant when instantiating objects and holding a reference to each instantiated object in that global configuration, so it was a memory leak after all. We iterated on a fix and added tests and a benchmark script to reproduce the issue. We submitted a detailed PR upstream so that other users of this gem don't experience this issue.
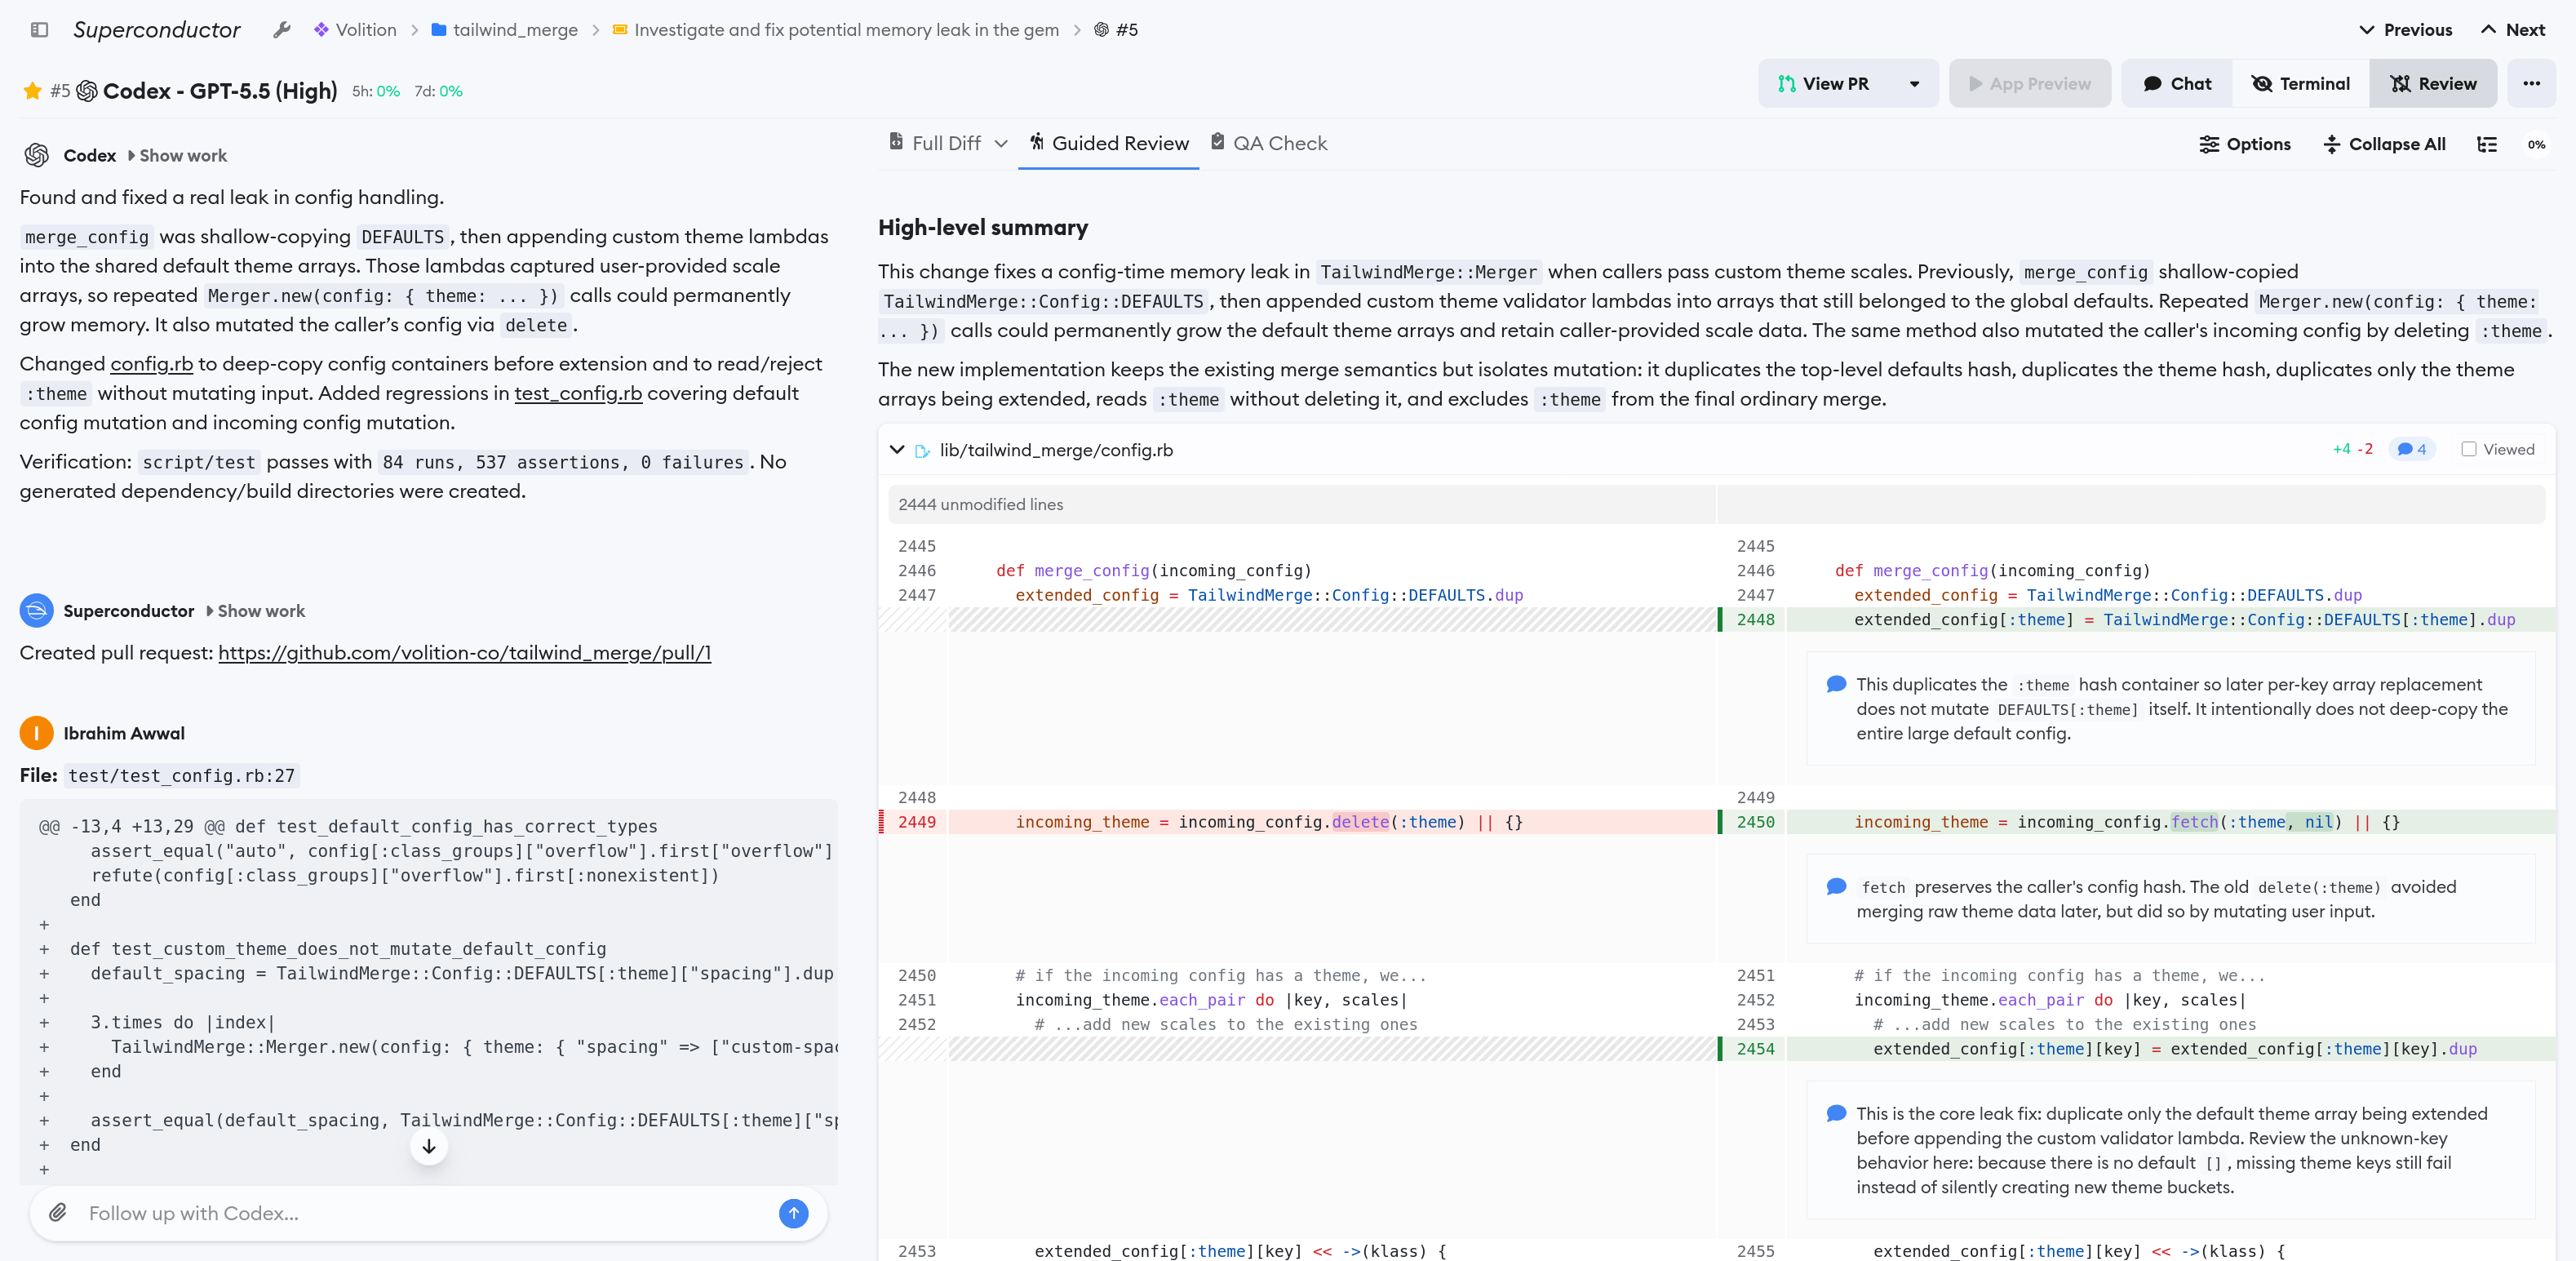
Now that we have a working setup with derailed_benchmarks, we turned that process into an Agent Skill in our repository so that future memory leaks are much easier to diagnose! You can see the shape of the skill at the end of this post.
The main lesson for me is that your first hunch can be useful, but it can also send agents down the wrong path. It helps to simplify the issue as much as possible, run the same investigation a few different ways, and compare the concrete artifacts the agents produced: screenshots, benchmark results, and live previews (where applicable). When you're using parallel coding agents, easily-verifiable outputs are critical for getting good results.
One thing that excites me about background coding agents is how they can improve the open-source ecosystem for everyone. Often as developers we treat upstream/dependency issues as “outside scope”. Digging into a new codebase to find and fix bugs can be a challenging endeavor, so issues go unfixed. At the same time, fixes need to be verified so that open-source maintainers are not drowned in a deluge of slop PRs purporting to fix issues that may not actually exist.
By running your apps in a real cloud sandbox, Superconductor makes it easier for coding agents to properly develop and test fixes, and use profiling tools like derailed_benchmarks that a developer would use, the way a developer would use them. And once you have a set of proposed changes, Superconductor makes it easier to verify and compare results and recommends the best implementation for you to start from.
The Agent Skill
Here is the shape of the skill we added:
# Derailed Benchmarks

Use this workflow to reproduce production-like Rails request memory growth locally,
collect allocation/retention data, and connect retained objects to a concrete fix.

## Setup

1. Verify the derailed_benchmarks rake tasks are available.
2. Boot Rails in `RAILS_ENV=production` with dummy env vars.
3. Never use real production credentials.
4. Precompile assets if production rendering needs compiled manifests.

## Memory Growth Probe

Run repeated requests against the endpoint being investigated:

RAILS_ENV=production \
SECRET_KEY_BASE=dummy \
DATABASE_URL=postgres://postgres:postgres@postgres:5432/app_development \
CACHE_REDIS_URL=redis://redis:6379/0 \
REDIS_URL=redis://redis:6379/1 \
RAILS_HOST=example.com \
PATH_TO_HIT=/target_path \
TEST_COUNT=1000 \
bundle exec rake -f perf.rake perf:mem_over_time

Interpretation:

- A small warmup rise that plateaus is acceptable.
- Monotonic growth across many samples suggests retained objects or allocator fragmentation.
- Increase `TEST_COUNT` if the run completes before a second sample prints.

## Allocation and Retention Probe

After reproducing growth, run:

RAILS_ENV=production \
SECRET_KEY_BASE=dummy \
DATABASE_URL=postgres://postgres:postgres@postgres:5432/app_development \
CACHE_REDIS_URL=redis://redis:6379/0 \
REDIS_URL=redis://redis:6379/1 \
RAILS_HOST=example.com \
PATH_TO_HIT=/target_path \
TEST_COUNT=50 \
bundle exec rake -f perf.rake perf:objects

Read these sections first:

- `Total retained`
- `retained objects by class`
- `allocated memory by gem/file/location`
- `Retained String Report`

## Report Checklist

Include:

- Exact endpoint and environment command shape.
- Baseline RSS slope and post-change RSS slope.
- `perf:objects` retained totals before/after.
- Retained classes/files that led to the diagnosis.
- A/B results for monitoring middleware if tested.
- Test/format commands run.
- Generated directories added to `.gitignore`.