
Debug with Grafana Cloud data and Superconductor coding agents
Connect Grafana Cloud to Superconductor and your coding agents can now read your dashboards, query metrics and logs, and check alerts and incidents while they debug. Superconductor runs the fix in a shared session, so your team can see the Grafana data behind a change and review it before it ships.
Superconductor lets you and your team chat with coding agents such as Claude Code, Codex, Pi, and more in shared, secure cloud sessions.
With our Grafana integration, you can
- Start a fix from the metrics and logs behind an alert
- Find the dashboard that tracks a service before changing it
- Mark a deploy on your dashboards with an annotation
Try asking
- This Grafana alert fired overnight. Check Sentry for matching errors, then fix the cause and open a PR.
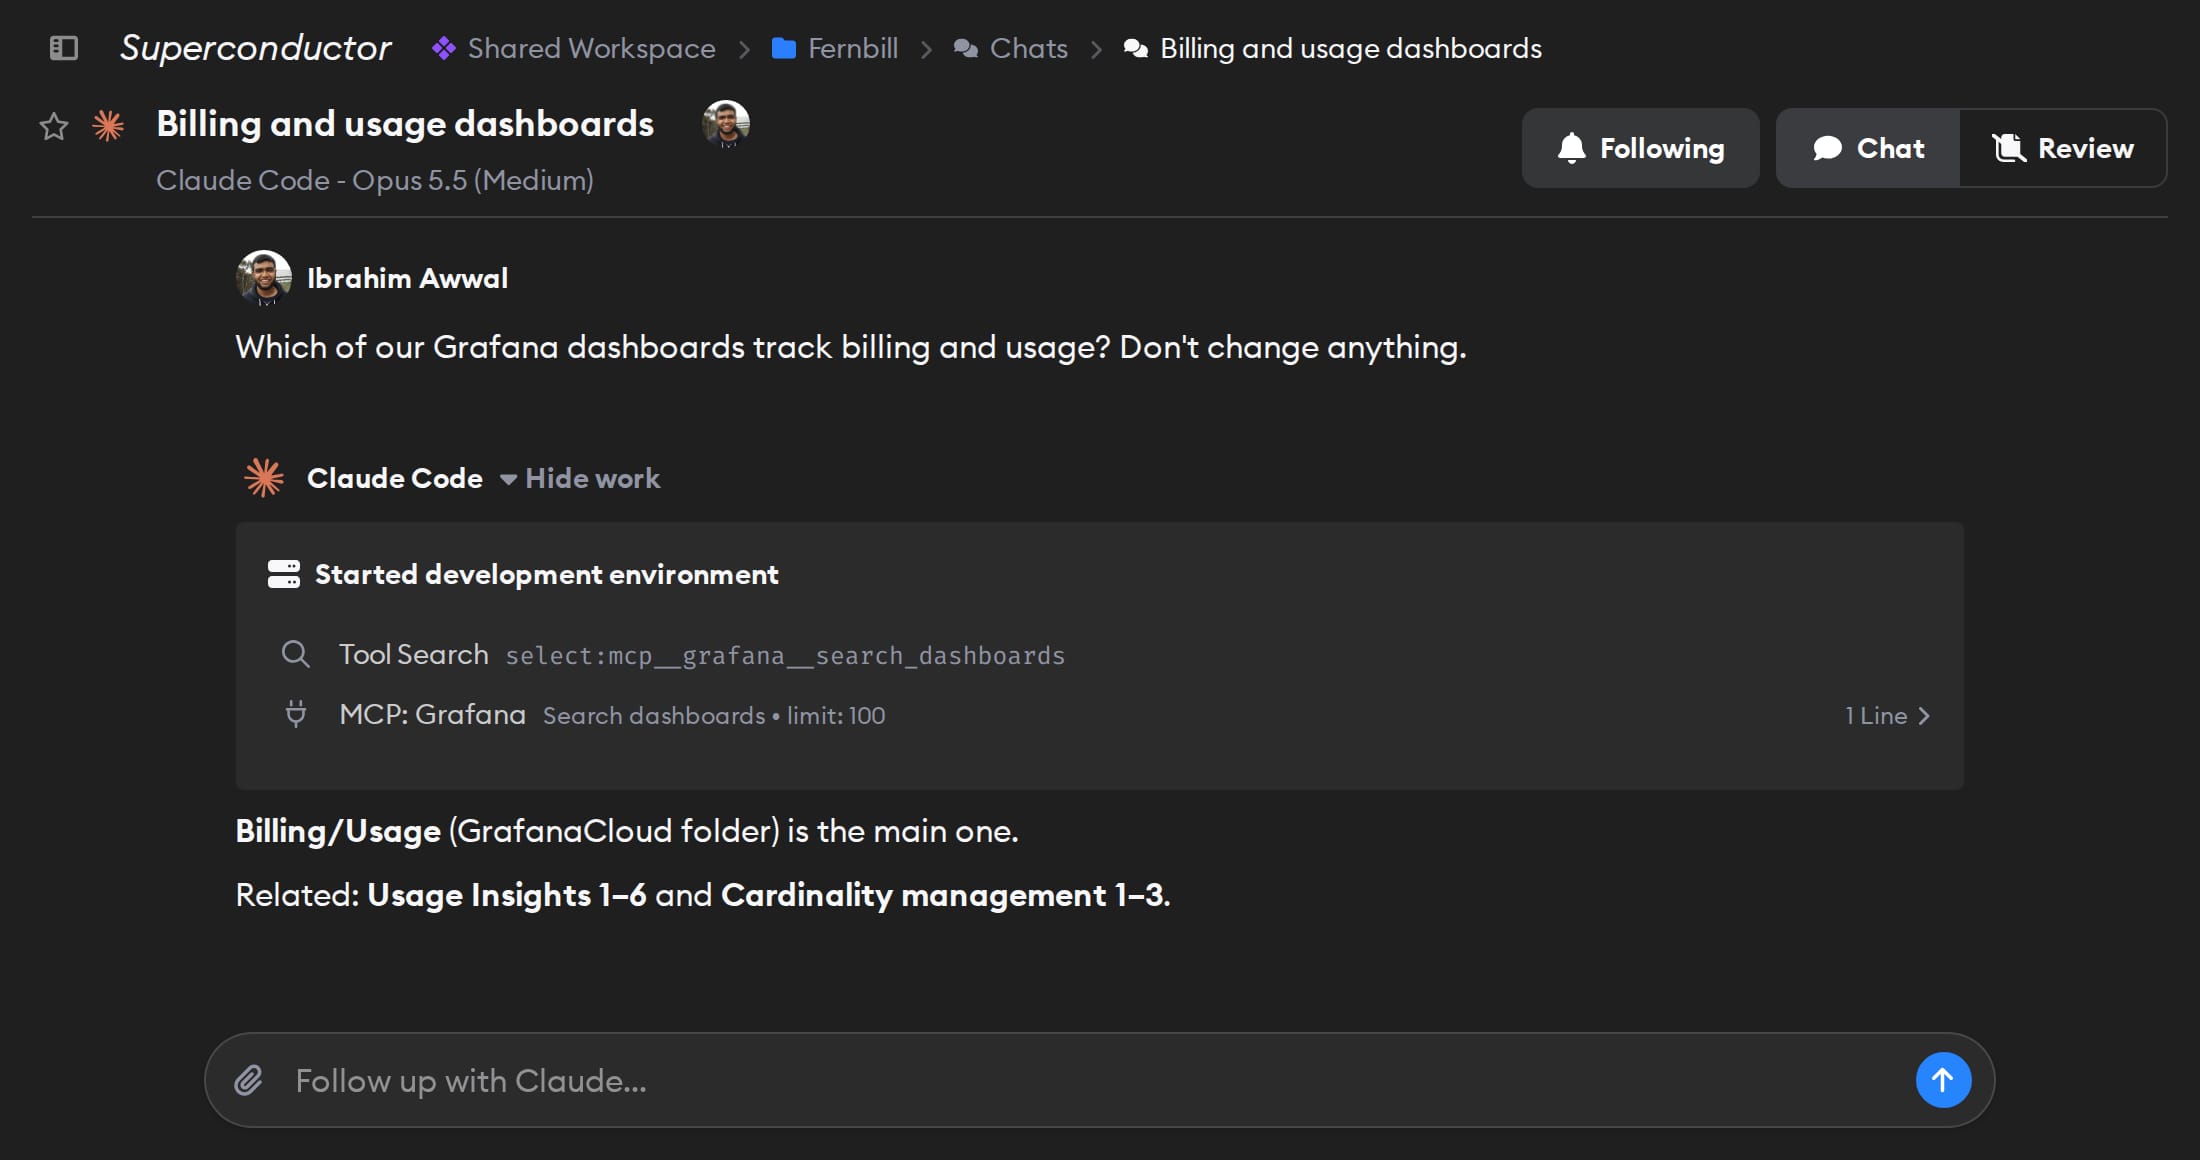
- Which of our Grafana dashboards track billing and usage, and what do their panels show? Don't change anything.
- List our Grafana alert rules and their contact points.
Technical details
- Agents can
- Query dashboards, metrics, logs, alerts, and incidents; make changes if you allow it
- Access
- What the signed-in Grafana user can do, within the access they approve
- Needs
- Sign in with Grafana Cloud; API keys aren't supported
- Server
- Grafana's hosted MCP server at
mcp.grafana.com
Example
Questions
- Can Claude Code use the Grafana MCP server?
- Yes. Connect Grafana in Superconductor and Claude Code gets its MCP tools. There's nothing to install.
- How do I connect Grafana?
- Click Connect on the Grafana card in Workspace Settings → Connectors and sign in. There's no API key to create.
- Can agents change things in Grafana?
- Only if you allow it when you sign in with Grafana.